


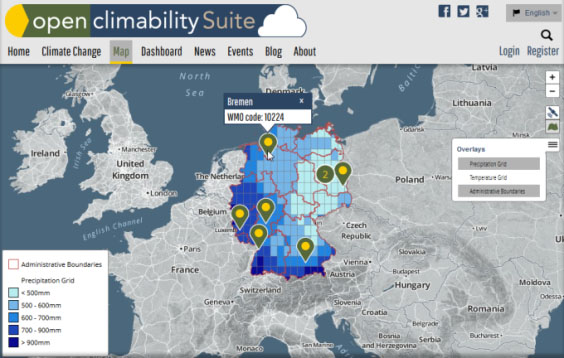
Climability Portal:
Your way to visualize
climate data.

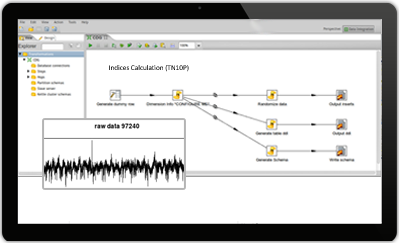
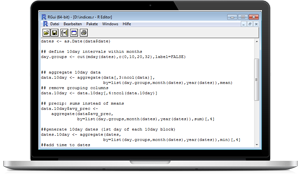

Toolbox:
Validate, clean and
process your climate data

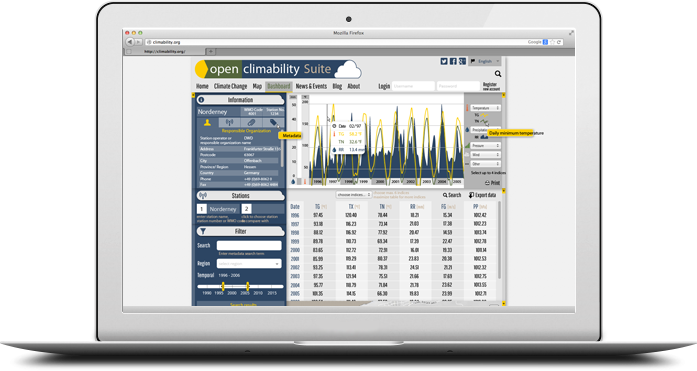
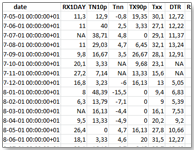
Use the dashboard to
analyse your climate data!